

Most sports bettors have no idea whether they’re actually profitable. They remember big wins vividly while conveniently forgetting losses; they sense whether they’re “running good” without knowing actual numbers. This selective memory creates dangerous self-deception — bettors believing they’re winning when they’re actually losing, or failing to recognize genuine skill because short-term variance obscures long-term results.
Systematic bet tracking transforms sports betting from guesswork into data-driven analysis. By recording every wager and analyzing the resulting data, you develop accurate understanding of your actual performance, identify strengths and weaknesses in your approach, and make informed decisions about where to focus future betting activity. The discipline of tracking itself often improves results by forcing conscious decision-making rather than impulsive betting.
Professional bettors track obsessively. They know their ROI by sport, bet type, and time period. They understand which situations produce profits and which create losses. They can identify whether a losing streak represents bad luck or bad analysis. This information asymmetry — pros knowing their true performance while recreational bettors operate on feel — contributes to the edge professionals hold.
What to Track for Each Bet
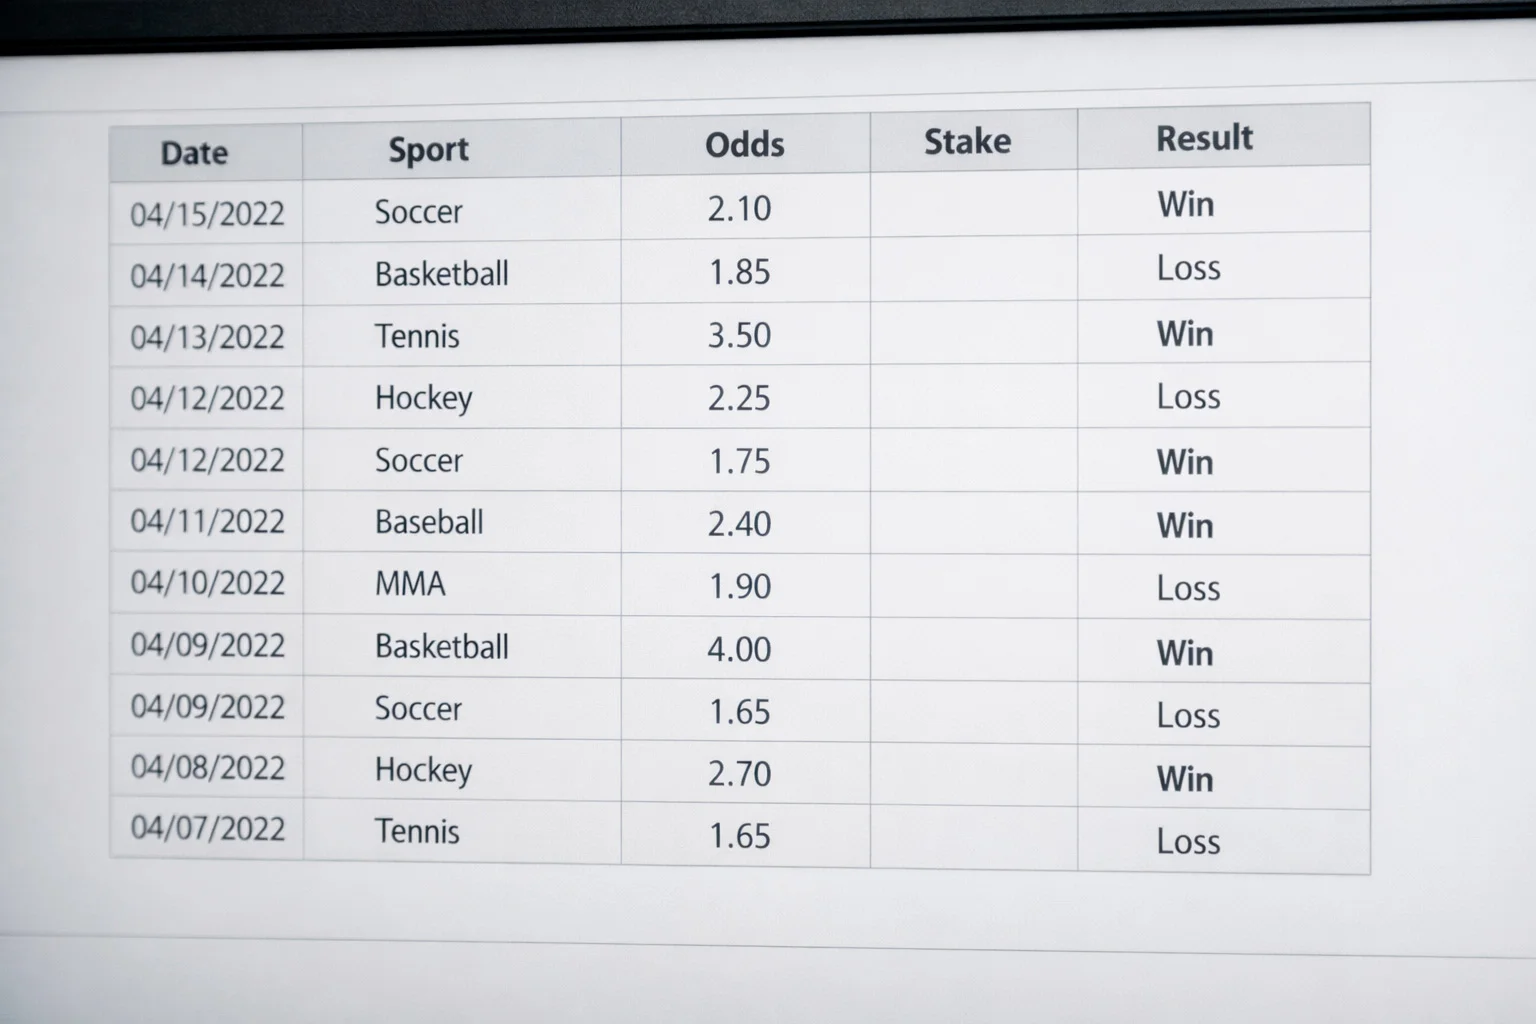
Comprehensive tracking captures details that enable meaningful analysis.
Date and time records when bets were placed. Timing analysis reveals patterns — perhaps your Sunday morning bets perform differently than Saturday night wagers. Date tracking enables filtering by time periods to assess trends.
Sport and league identifies what you bet on. Tracking by sport reveals where you perform best. Perhaps your NHL betting produces positive returns while NBA betting loses money. Without sport-specific tracking, this crucial information remains hidden.
Bet type categorizes the wager: moneyline, spread, total, prop, parlay, future. Different bet types may produce different results. You might excel at totals but struggle with spreads; you might profit on straight bets but lose on parlays. Bet type analysis guides strategic focus.
Teams/players involved documents the specific matchup. Recording participants enables head-to-head analysis and helps identify patterns in team or player-related betting.
Odds at bet placement records the price you received. Odds tracking enables closing line value analysis — comparing your bet odds to where lines closed. Consistently beating closing lines suggests genuine edge; consistently losing to closing lines indicates problems regardless of short-term results.
Stake amount records how much you risked. Stake tracking calculates ROI accurately (rather than just counting wins and losses) and reveals whether bet sizing patterns correlate with performance.
Result records the outcome: win, loss, push, or void. The fundamental data point that enables everything else.
Profit/loss calculates the financial impact. A $100 bet at -110 odds that wins produces $90.91 profit; the same bet losing costs $100. Accurate profit/loss tracking requires understanding how odds translate to actual returns.
Closing line records where odds settled before event start. This optional but valuable field enables closing line value analysis — a metric many professional bettors consider more important than actual results for predicting long-term success.
Notes capture reasoning, circumstances, or observations. Why did you make this bet? What information influenced the decision? Notes enable retrospective analysis of your decision-making process.
To maximize your potential returns, always practice line shopping in Canada across bookies.
Choosing a Tracking Method
Several approaches to bet tracking suit different preferences and commitment levels.
Spreadsheets (Excel or Google Sheets) offer flexibility and control. You design the tracking structure, add whatever fields matter to you, and create custom analysis. Free templates available online provide starting points; you can modify them to match your needs. Spreadsheets require manual entry — you must discipline yourself to record every bet — but provide complete ownership of your data.
Dedicated bet tracking apps automate some processes and provide built-in analysis. Apps like Action Network, Pikkit, or specialized tracking tools can import bets from connected sportsbooks, calculate statistics automatically, and visualize performance. The convenience comes with potential limitations on customization and dependence on third-party services.
Sportsbook bet history provides raw data but limited analysis. Most sportsbooks let you view past bets, but this historical record lacks the categorization and analysis that proper tracking enables. Sportsbook history serves as backup verification but shouldn’t replace dedicated tracking.
Notebooks work for low-volume bettors who prefer analog methods. Writing bets in a physical journal maintains the discipline of recording without technology requirements. However, analysis requires manual calculation, limiting the insights available compared to digital methods.
Whatever method you choose, consistency matters most. A simple system you actually use beats a sophisticated system you abandon after two weeks. Start with basic fields and expand as habits solidify.
Key Performance Metrics
Several metrics reveal different aspects of betting performance.
Win rate measures how often your bets win. At standard -110 odds, break-even requires approximately 52.4% wins. Win rate provides simple performance indication but doesn’t account for odds variation — winning 60% of -300 favorites produces different results than winning 60% of +150 underdogs.
Return on Investment (ROI) measures profit relative to total amount wagered. The formula: (Total Profit ÷ Total Wagered) × 100. A bettor who wagered $10,000 total and ended with $10,500 has 5% ROI. This percentage enables comparison across different bankroll sizes and betting volumes. Professional sports bettors typically achieve 2-7% long-term ROI; anything above 5% sustained over large samples indicates strong performance.
Yield (also called profit margin) measures profit per bet rather than per dollar wagered. Similar to ROI but calculated differently, yield helps assess efficiency when bet sizes vary significantly.
Closing Line Value (CLV) measures whether you bet at better prices than where lines closed. If you bet a team at +150 and the line closed at +130, you achieved positive CLV — your odds exceeded the market’s final assessment. Consistently positive CLV suggests you’re identifying value before markets fully adjust, predicting long-term profitability more reliably than short-term results alone.
Units won/lost standardizes results regardless of actual stake sizes. If your standard bet is $100 (one unit), a $50.50 profit represents 0.505 units won. Unit tracking enables performance comparison without revealing actual dollar amounts.
Analyzing Your Data
Raw data gains value through analysis that reveals patterns and insights.
Performance by sport identifies where you excel and struggle. Filter your tracking data by sport; calculate ROI for each. If NHL betting shows +6% ROI while NBA shows -4%, the implication is clear: bet more hockey, less basketball (or improve your basketball analysis before continuing).
Performance by bet type reveals structural strengths. Perhaps you profit on totals but lose on spreads. Maybe props provide edge while moneylines don’t. Understanding bet type performance guides market focus.
Performance over time tracks improvement or decline. Monthly or quarterly ROI trends show whether your results are improving, stable, or deteriorating. Positive trends encourage current approaches; negative trends demand reassessment.
Performance by odds range examines whether you perform better on favorites, underdogs, or specific price ranges. Some bettors consistently profit on short favorites; others excel with longshots. Understanding your odds range performance focuses betting activity.
Closing line value trends reveal skill separate from luck. Sustained positive CLV suggests genuine edge even during losing stretches; sustained negative CLV indicates problems even during winning runs. CLV analysis provides process feedback independent of outcome variance.
Using Tracking for Improvement
Tracking data enables concrete improvement actions rather than vague resolutions.
Eliminate proven weaknesses. If data shows consistent losses on specific bet types, sports, or situations, stop betting them until you’ve identified and addressed the problem. Continuing losing activity hoping results will change wastes bankroll.
Double down on strengths. If analysis reveals profitable areas, consider increasing focus there. Rather than betting everything equally, weight activity toward situations where you’ve demonstrated edge.
Test hypotheses systematically. Think you’ve identified a new angle? Track bets using that approach separately from your general betting. After sufficient sample size, evaluate whether the hypothesis produces positive results.
Review decision-making through notes. Periodically read bet notes to assess your reasoning. Did your logic prove correct even when bets lost? Did flawed reasoning happen to produce wins? Process review improves future decisions.
Adjust stake sizing based on performance. If certain bet types consistently outperform others, consider sizing those bets larger. Kelly Criterion and similar approaches use historical performance to optimize bet sizing mathematically.

Maintaining Tracking Discipline
The challenge isn’t starting to track — it’s maintaining the habit consistently over months and years.
Record bets immediately after placing them. Delayed entry leads to forgotten bets and incomplete records. Build the habit of tracking as integral to the betting process itself.
Include all bets, even embarrassing ones. Selective tracking that omits impulsive bad bets produces misleading data. Complete records, however unflattering, enable accurate analysis.
Set regular review schedules. Weekly quick reviews and monthly deeper analysis maintain engagement with your data. Reviews reinforce tracking habits by demonstrating the value of accumulated information.
Start simple, expand gradually. Beginning with overly complex tracking often leads to abandonment. Start with essential fields; add complexity only after basic tracking becomes habitual.
Tracking requires discipline and time investment, but the insights produced justify the effort. Serious bettors who want to improve their results or simply understand their actual performance cannot afford to operate without systematic records. The data doesn’t lie, even when our memories do.
Improve your ROI on our sports wagering dashboard.
